Can You Use Flows to Estimate Price Reversals?
Firstly, you need to understand the difference between total and circulating market cap. Understand that over time, circulating market cap will increase to approach the total market cap.
Summary:
- Yes, you can
- Firstly, you need to understand the difference between total and circulating market cap. Understand that over time, circulating market cap will increase to approach the total market cap. The rate of increase is called the “emission rate”
- The ratio of the daily emission rate vs daily trading volume will give traders an idea of the amount of pressure on the token price
- Daily trend of the abovementioned ratio will allow you to approximate price reversals

Let’s start from the most basic… What is Market Cap?
- In cryptocurrency, the market cap is the total value of a cryptocurrency which shows the relative size of a cryptocurrency. This way, we can see the value of cryptocurrency more fairly since some coins have high prices but low supply while others are the opposite.
- Market cap can be calculated by multiplying the current price of a cryptocurrency with its supply.
- Circulating market cap uses circulating supply in its calculation, this is because circulating market cap assumes that coins that are not circulating for some reasons do not have any effect on the token’s value. While total market cap uses total supply in its calculation, counting unminted and locked tokens.
Circulating Market Cap vs Total Market Cap
- Total market cap is used to compare tokens more fairly between tokens with fixed supply and tokens with no fixed supply. This is because some token might have low circulating token when it was first released, but more tokens actually already exist somewhere without being circulated.
- But, total market cap does not take emission rate and inflation rate, which might make it not very accurate.
- Meanwhile, circulating market cap usually indicates how many tokens are in circulation right now. This can show the true market cap for coins with fixed supply, like Bitcoin for example, since their total market cap value is fixed.
- Since new tokens will keep released to the public, circulating market cap will grow with time until it reaches total market cap, which is the market cap when total supply has already reached. This growth rate is also known as emission rate.
- But, circulating market cap does not take into account unreleased tokens, which might make comparison biased to tokens that already exist longer or have a lot minted token already.
Daily Emission Rate
- Daily emission rate is the rate of tokens being released for 24 hours. Analysis of the token emission rate is very important, more so during bear market, since it can indicate whether a token’s price is going to rise or fall.
- The reason for the daily emission rate’s importance is because during bear market new token emission might affect the price badly. Since in bear market volume of traded tokens is decreasing, new token emission will decrease its price since many released tokens are not being bought or used in transaction.


Emission Rate Analysis
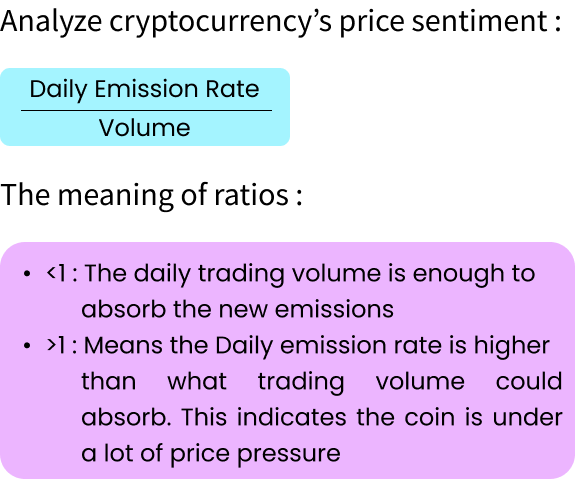
- There is a way to analyze cryptocurrency’s price sentiment by dividing its daily emission rate with its volume to get its ratio.
- When the ratio is below one, we can assume that said coin is on an upward trend, since the volume traded is higher than the volume released. On the contrary, when the ratio is above one, we can assume that the coin is on a downward trend since many released tokens are not used in trading.
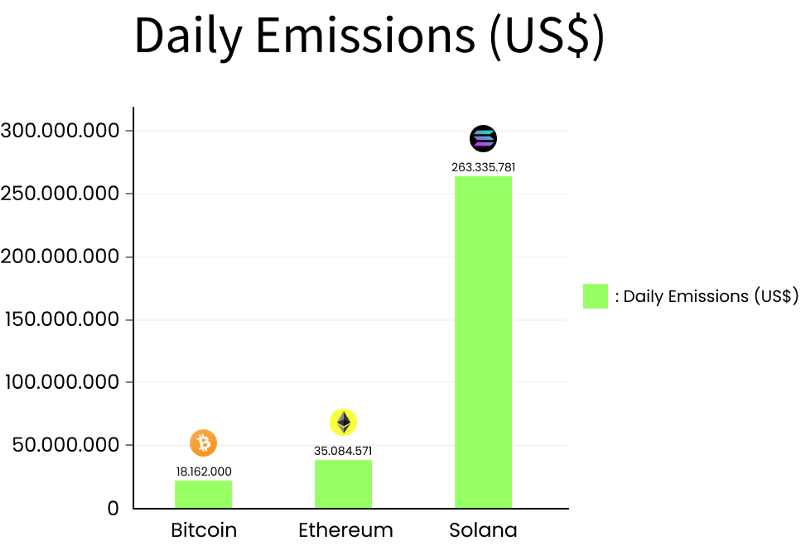
- For comparison, we can see the top cryptocurrencies. First, for Bitcoin it has a circulating market cap of 388 billion USD and an inflation rate of around 900 BTC per day. While Ethereum has an uncapped supply of around 137 billion USD and an inflation rate of 30,857 ETH daily, but the release of EIP 1559 introduced a system where Ethereum can be ‘burned’ to make it deflationary in the long term. Next, there is Solana with a market cap of 19.67 billion USD and an inflation rate of 7,523,879 SOL daily.

- For example, we can take Bitcoin’s daily emission of around 18 million USD daily and volume of 4 billion USD daily. By using the formula, we can find the daily emission rate to volume ratio is around 0,45%, which means that Bitcoin is still very highly used and its emission rate pretty low.
- The other example is Ethereum with a daily emission rate to volume ratio of around 1,18%, which while very low is still higher than Bitcoin’s.
- Another one is Solana with a daily emission rate to volume ratio of around 49,87%, which is pretty high since Solana’s daily emission rate is far higher than the other two with around 263 million USD daily.